Valve’s Steam Hardware Survey is useful because it gives us a recurring look at the hardware showing up in Steam’s gaming ecosystem. It is also easy to overread.
For this analysis, Instant Game Zone locked the main population to Valve’s Windows-only survey data and tracked a consistent April-to-September 2026 window. That matters because Valve’s combined Windows, macOS and Linux view can produce a very different answer from the Windows-specific view.
The September snapshot is a good example. In Valve’s Windows-only data, 8GB is still the largest VRAM tier among the capacities tracked here at 35.78%, while 16GB is 11.35%. In Valve’s combined-platform view, 16GB is 27.21% and narrowly leads 8GB at 26.71%.
Neither view is inherently wrong. They describe different populations.
The six-month Windows data also shows why a single monthly headline can miss the more useful picture:
- the RTX 5070 rose from 3.01% in April to 6.15% in September, a gain of 3.14 percentage points.
- the RTX 3060 moved from 4.15% to 3.66%, down 0.49 percentage points across the same window.
- Windows-only 12GB VRAM rose from 14.31% to 17.04%, while 8GB still remained the largest tracked Windows tier at 35.78%.
- 1080p remained the largest individual primary resolution at 49.10%, but it no longer represented a majority of the Windows sample.
- 1440p reached 27.76%, up 5.79 percentage points from April.
September also needs more caution than an ordinary monthly update. Several hardware and display categories moved sharply at the same time that Valve’s Windows respondent-language mix changed substantially. Those movements describe the survey. They do not tell us why the changes happened, how many GPUs were sold, or what the entire PC market looks like.
What Steam actually measures
Valve describes the Steam Hardware & Software Survey as monthly, optional and anonymous. Its purpose is to collect information about the hardware and software used by participating Steam customers.
That makes the survey valuable, but it is not a census.
This article therefore uses survey share, not “global market share” or “share of all PC gamers.” We also keep the same Windows-only scope across the main trend charts so that April and September are actually comparable.
There is another reason to be careful: the survey has had collection and reporting problems.
Valve’s February 24, 2026 Steam Client Beta notes say the company fixed incorrect VRAM reporting on some graphics cards and changed how systems with multiple display adapters were selected for reporting. February also produced unusually large GPU movements that did not behave like a normal month afterward.
For that reason, February is excluded from the ordinary trend calculations here. The main analysis starts in April and runs through September.
Why September needs extra caution
September is retained in the trend because it is Valve’s published monthly survey result, but IGZ treats it as a composition-sensitive observation rather than an ordinary continuation of April through August.
In Valve’s Windows-only language table, Simplified Chinese rose from 25.28% in August to 32.84% in September, a 7.56 percentage-point increase. English moved from 35.69% to 31.91%, down 3.78 points.
At the same time, several tracked hardware and display rows made unusually large one-month moves. The RTX 5070 rose 2.38 percentage points from August to September, 12GB Windows VRAM rose 2.47 points, and 2560×1440 rose 5.31 points.
The pattern is not limited to the three categories charted in this article. Valve’s Windows data also shows 32GB system RAM up 4.81 points, AMD CPU share up 1.89 points, and eight-physical-CPU systems up 2.10 points in September. But not every category moved sharply: Windows 11 changed by only 0.45 points.
Valve’s public survey does not provide the hardware-by-language cross-tabs needed to assign those hardware movements to a specific respondent group. IGZ therefore does not claim that the language shift caused the RTX 5070, VRAM or 1440p changes. We keep September in the six-month series, show the published values, and avoid turning the correlation into a causal upgrade story.
Source: Valve Steam Hardware & Software Survey
The GPU installed base is changing, but not all at once
The Windows video-card table still looks like a mixed installed base rather than a clean handoff from one generation to another.
In September, the first ten model rows in Valve’s PC video-card table were:
| GPU | April 2026 | September 2026 | Apr–Sep change |
|---|---|---|---|
| GeForce RTX 5070 | 3.01% | 6.15% | +3.14 pp |
| GeForce RTX 5060 | 2.71% | 4.40% | +1.69 pp |
| GeForce RTX 5060 Ti | 1.90% | 4.06% | +2.16 pp |
| GeForce RTX 4060 | 4.05% | 3.89% | -0.16 pp |
| GeForce RTX 3060 | 4.15% | 3.66% | -0.49 pp |
| GeForce RTX 4060 Laptop GPU | 3.98% | 3.50% | -0.48 pp |
| GeForce RTX 3050 | 3.20% | 2.90% | -0.30 pp |
| GeForce RTX 4060 Ti | 2.57% | 2.85% | +0.28 pp |
| GeForce RTX 5060 Laptop GPU | 1.71% | 2.45% | +0.74 pp |
| GeForce GTX 1650 | 2.70% | 2.19% | -0.51 pp |
These are percentages of the Windows Steam Hardware Survey population represented by each published row. They are not sales figures.
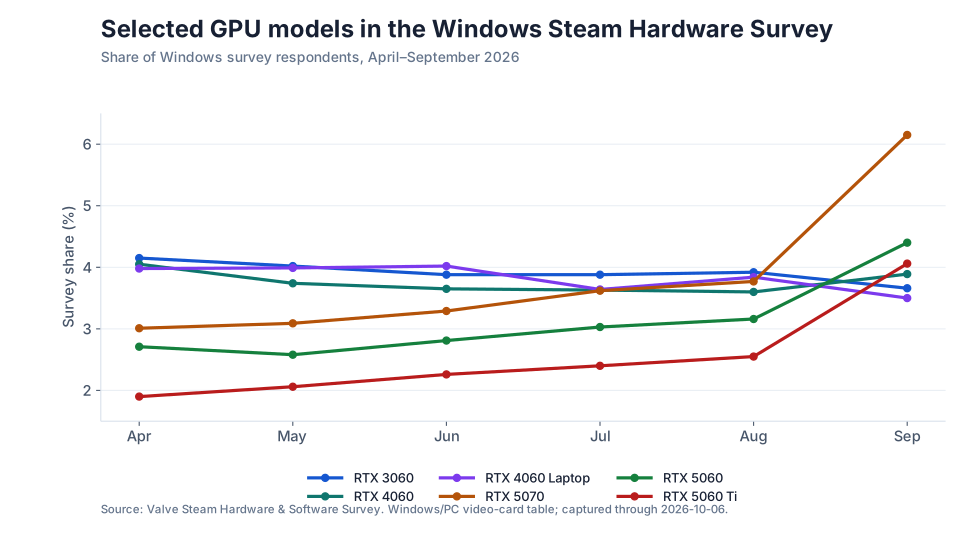
The selected six-month chart makes two things clear.
First, the installed base is still mixed. The RTX 3060 moved from 4.15% in April to 3.66% in September. It no longer leads the named rows, but it remains common enough in the survey to matter for game support and upgrade coverage.
Second, newer cards can gain survey share quickly without the survey telling us why. The RTX 5070 rose by 3.14 percentage points from April to September, the RTX 5060 Ti by 2.16 points, and the RTX 5060 by 1.69 points. September accounts for a large part of those gains, which is why the composition warning matters.
That is useful context for upgrade coverage. A hardware site focused only on the newest flagship cards can miss the systems a large part of the active Windows Steam survey population is still using.
It is not evidence that an older GPU is “good enough” for every modern game. Popularity and performance are different questions.
VRAM is where survey scope changes the story
The easiest Steam Hardware Survey headline to get wrong in 2026 is VRAM.
Valve’s September combined-platform view shows:
| VRAM | Windows-only | Combined platforms |
|---|---|---|
| 8GB | 35.78% | 26.71% |
| 12GB | 17.04% | 13.06% |
| 16GB | 11.35% | 27.21% |
| 24GB | 1.53% | 5.50% |
If you read only the combined view, 16GB is the largest of these tiers. If your question is specifically about the Windows Steam survey population, 8GB is still much more common.
That difference is large enough that the population needs to be attached to the statistic every time.
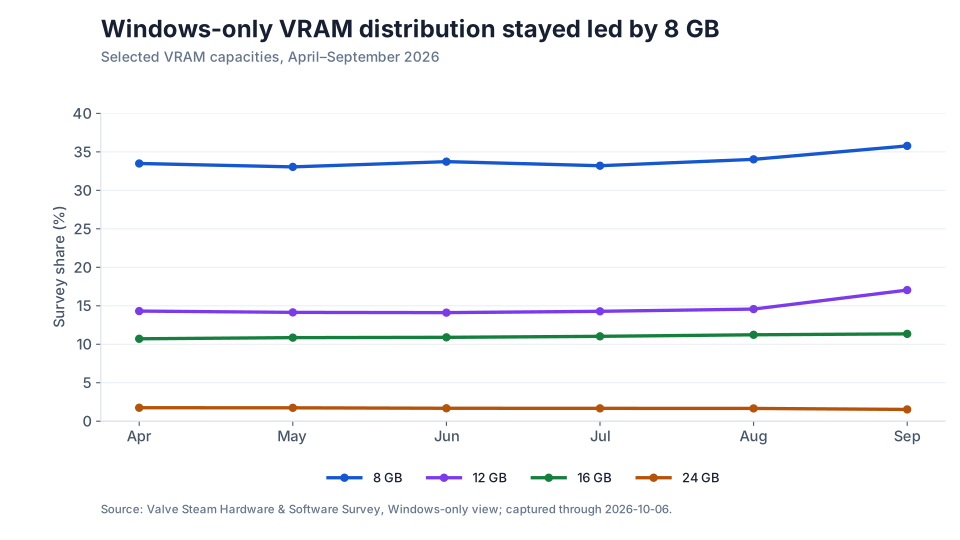
The six-month Windows-only trend adds another useful check. From April to September:
- 8GB moved from 33.49% to 35.78%, up 2.29 percentage points.
- 12GB moved from 14.31% to 17.04%, up 2.73 points.
- 16GB moved from 10.71% to 11.35%, up 0.64 points.
- 24GB moved from 1.75% to 1.53%, down 0.22 points.
So the Windows data does not show a simple six-month story where 8GB is being replaced by 16GB. Both 8GB and 16GB are above their April shares, while 12GB shows the largest increase among the four capacities tracked here.
September’s one-month VRAM movement is unusually large, especially for 12GB, so the survey still cannot establish the cause of the change.
For buying advice, VRAM capacity still has to be considered alongside the actual GPU, target game, settings, resolution and performance evidence. A common capacity is not automatically the right capacity for your next purchase.
1080p is still the largest Windows resolution, but September drops it below half
Primary display resolution is another useful reality check.
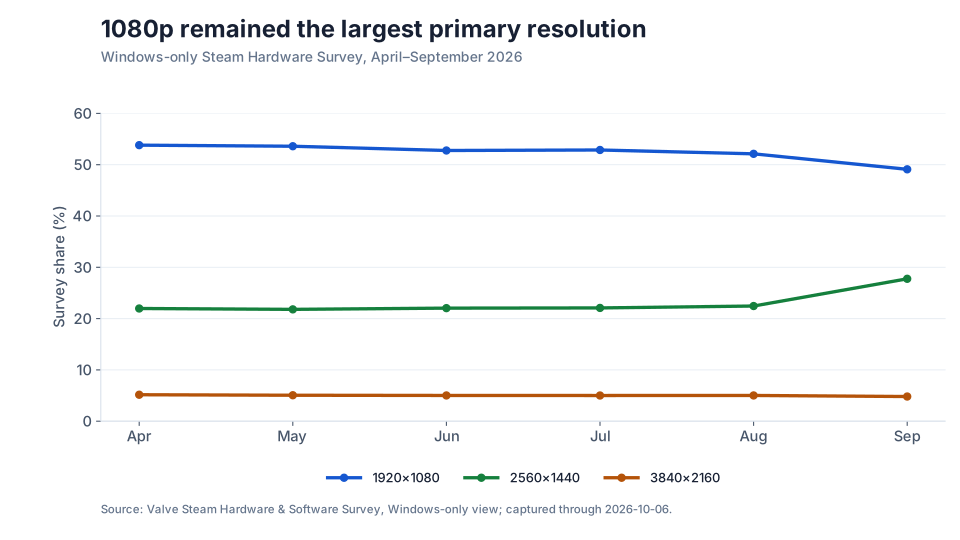
Across the Windows-only survey:
| Primary resolution | April 2026 | September 2026 | Apr–Sep change |
|---|---|---|---|
| 1920×1080 | 53.81% | 49.10% | -4.71 pp |
| 2560×1440 | 21.97% | 27.76% | +5.79 pp |
| 3840×2160 | 5.16% | 4.81% | -0.35 pp |
1080p is still the largest individual Windows resolution in September, but at 49.10% it no longer represents a majority of the reported Windows sample.
1440p rises sharply to 27.76%. 4K remains close to 5%.
It would be tempting to turn the September movement into a story that Windows players are directly moving from 1080p to 1440p. The survey does not prove that. The one-month change happens alongside a much larger shift in the respondent-language mix, and Valve’s public data does not provide the cross-tabs needed to establish causation.
What the data does support is a simpler point: 4K is still not the typical Windows Steam target. 1080p remains the largest single resolution, with 1440p now a substantial second group in the September survey.
What this means for an RTX 3060 owner
The RTX 3060 is a useful example because it connects installed-base evidence with a real upgrade decision.
Valve’s Windows PC video-card table shows the RTX 3060 at 3.66% in September, compared with 4.15% in April. It no longer leads the named GPU rows, but it remains one of the larger individual entries in the survey.
That tells us the RTX 3060 is still relevant enough to deserve serious support and upgrade coverage.
It does not tell an owner to keep it.
An upgrade decision should still start with the games you play, the frame rate you want, your target resolution, the image-quality features you care about and the price of a meaningful replacement.
If an RTX 3060 still delivers the experience you want at 1080p, its age alone is not a reason to spend money. If you are moving to 1440p, heavier ray tracing or a higher-refresh target, the performance gap to newer GPUs matters much more than Steam popularity.
Our separate RTX 3060 Upgrade Guide for 2026 compares that decision using independent performance evidence and current upgrade options.
If you are specifically weighing the RTX 3060 against the newer RTX 5060, our RTX 3060 vs RTX 5060 comparison focuses on that one upgrade path, including the 12GB-to-8GB VRAM tradeoff.
The Steam survey adds context. It does not replace performance testing.
What the Steam survey cannot tell you
This dataset becomes less useful when it is pushed beyond its limits.
The Steam Hardware Survey does not tell us:
- how many units of a GPU were sold
- global gaming-PC market share
- the total number of people using each GPU
- why a model gained or lost survey share
- whether a GPU can hit your target frame rate in a particular game
- whether 8GB, 12GB or 16GB is sufficient for every workload
- whether someone should upgrade simply because newer hardware is becoming more common
It can show which configurations are represented in the survey and how those shares change over time.
The rest needs other evidence.
Methodology and anomaly rules
This version uses a deliberately narrow method.
Population: Valve’s Windows-only Steam Hardware & Software Survey where the Windows view is available.
Trend window: April through September 2026.
GPU data: Valve’s PC Video Card Usage Details table.
VRAM and resolution: Windows-only Valve survey values.
Combined-platform data: used only in the separate September VRAM comparison to demonstrate why scope matters.
Composition controls: Windows-only language, system RAM, CPU-vendor, physical-CPU-count and Windows-version rows are kept in a separate supporting dataset. They are used to test whether September behaves like an ordinary monthly update, not to expand the article into new hardware categories.
February 2026: excluded from ordinary trend calculations because Valve documented VRAM and multi-adapter reporting fixes during that period and the month produced abnormal movements.
September 2026: retained as Valve’s published result but marked composition-sensitive because several hardware and display categories moved unusually sharply while the Windows respondent-language mix also changed substantially. The public data does not establish a causal link between those observations.
No interpolation: missing or suspicious values are not silently filled.
No hidden aggregation: we do not sum incomplete visible GPU rows into manufacturer or generation “market share.”
Change calculation: share movements are reported in percentage points.
Claim boundary: observed survey values and IGZ-derived comparisons are separated from causal explanations. The latter require evidence the public survey does not provide.
The underlying v1 research snapshot contains only values captured from Valve. Third-party historical datasets were used to understand potential data-quality problems, not as the source of the published numbers.
Primary data:
- Steam Hardware & Software Survey
- Steam PC Video Card Usage Details
- Valve Steam Client Beta notes covering the February 2026 survey fixes
For more evidence-led analysis, visit IGZ Research. For upgrade guides and hardware coverage, browse Hardware.
Update history
October 6, 2026: Extended the Windows-only trend through Valve’s September survey, regenerated the GPU, VRAM and resolution charts, and added a respondent-composition warning because September showed unusually large simultaneous shifts across several hardware and display categories.
September 19, 2026: Initial research version prepared with data through Valve’s August 2026 survey. Main trend scope locked to Windows-only data. April–August window established. February 2026 excluded from ordinary trend math.
This is intended to be a living research asset. When Valve publishes a newer survey, we will recheck category names, anomalies and scope before extending the charts rather than automatically appending a new point.